
StockML Dev Notes #4 - Combined Parity Index
One of the many issues with our MVP from the last post was that the candlestick pattern matcher picks up way too many hits, making the information almost indecipherable.
Originally I considered using candlestick patterns only on weekly bars to resolve this issue, but I thought there ought to be better ways to capture of the granularity of this data. Hence we need to combine the daily signals.
Interpreting signals
A matched candlestick pattern can be considered an signal, we have a lot of these that analyst look out for. MACD crossover signals are good examples, analysts have theorized that they indicate future movements of the underlying stock.
It is then important to categorize an signal’s probability on the future direction of the stock. A signal can be categorized by type: Reversal, Continuous, or Indecision, and by the price direction it has affinity to: Bullish, Bearish, or Both. For example,
| Signal Name | Type | Affinity | Probability |
|---|---|---|---|
| Three Outside Up | Reversal | Bullish | 75% |
means that the “Three Outside Up” candlestick pattern gives a 75% indication that a bullish reversal is coming up. Affinity is explicitly stated because a lot of times the same reversal signal will have different probabilities for bullish and bearish outlooks.
Combining the signal to get parity
A useful metric to combine these signals on would be a parity index, stacking bullish and bearish signals on their probabilities. At the same time, using indecision signals to create a neutral pocket for the index, which works with bullish and bearish lines to decipher the combined signals.
To make this index more readable, the initial idea is two folds:
- input signals are mapped to the four new signal lines based on their type and affinity
- Bullish Reversal, Bearish Reversal, Bullish Continuation, Bearish Continuation
- normalize probabilities and sum them, however since higher probability signals are so much more valuable, we normalize to the Fibonacci sequence
52.5-55 -> 1,55-60 -> 2,60-65 -> 3…- indecision signals map to
1when their probabilities are within50-52.5
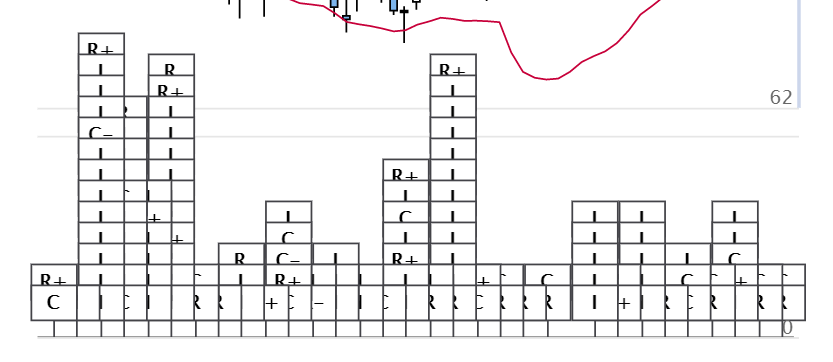
The same set of signals indicated by flags earlier this article maps to the following CPI, looks decent for a first pass.
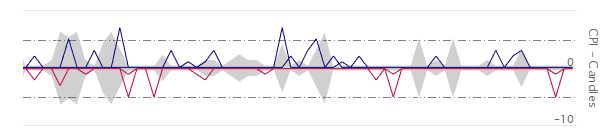
If any bullish and bearish signal lines move beyond the neutral pocket, then CPI indicates that the future movement of the stock should be in the corresponding direction. This applies to both reversal and continuation indications.
Next steps for the CPI
Besides attempting different normalization and smoothing techniques on the signal lines, there are some other ideas to improve this index:
- using EMA to smooth the new signal lines, i.e. letting momentum carryover
- incorporating signals beyond candlestick patterns, ex. RSI signals for reversal
- though we seed a set of probabilities and affinities, they should update adaptively to new information